The Asset Allocator Dilemma
- Mar 10
- 12 min read
The most important piece of news this year about Asset Allocation, believe it or not, is not related to Artificial Intelligence. In early February, Princeton University published its annual letter with the results of its endowment. The detail that caught our attention the most was the downward revision of the expected long-term return from 10.2% p.a. to 8% p.a.
For a long-term investor, the compounding effect on time of reducing returns from 2 digits to 1 digit is dramatic. Over 25 and 50 years, a return of 2% lower per year implies a cumulative reduction of 40% and 64% less (!), respectively, in the cumulative period.
Chart 1: $1 at time, with compound returns of 10.2% p.a. and 8% p.a.
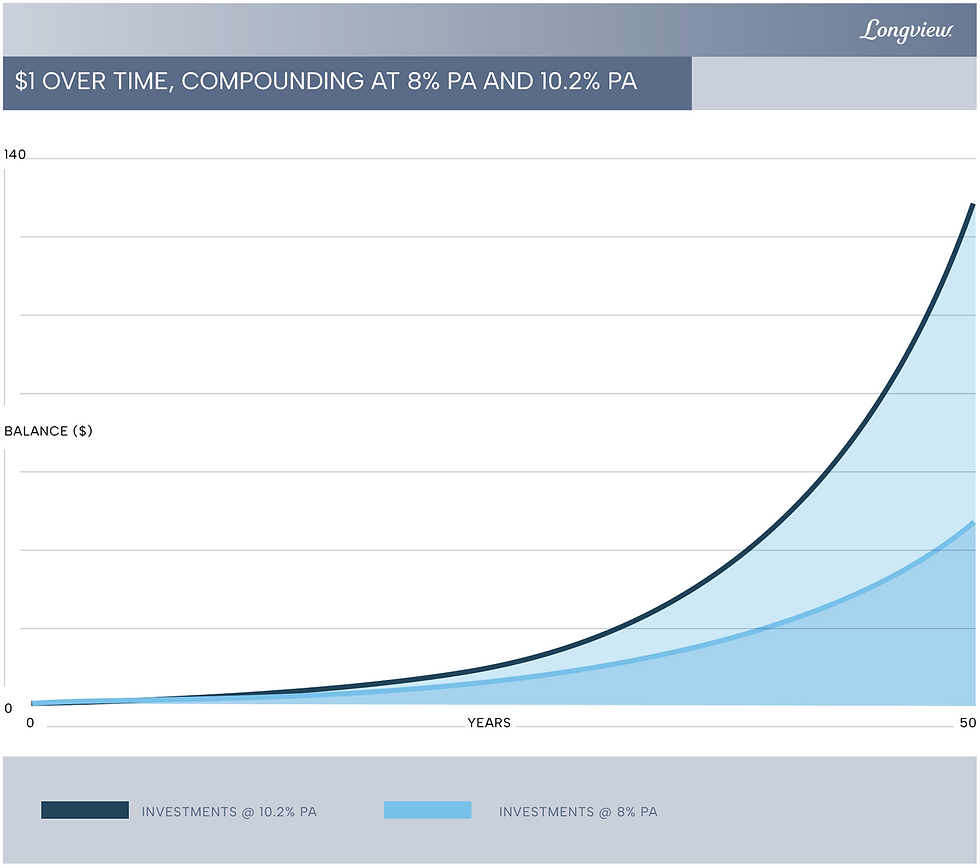
Source: Longview Capital
The assumption change was supported by decreasing expected returns coming from Private Equity (which today represent 40% of the total endowment). And to make matters worse, because Private Equity investments are illiquid, portfolio adjustments take literally years (or even decades) to implement. For Princeton, in addition to facing diminishing returns on its assets going forward, there remains the added challenge of higher cost inflation.
Princeton's mea culpa reopens the discussion of whether the endowment allocation framework, better known as the "Yale Model", remains the industry's "gold standard" or not.
Is "Yale Model" dead?
The majority of US endowments based their asset allocation on the so-called "Yale Model", conceived by the Yale University investment team led by David Swensen in the 80s. Until Swensen's death in 2021, Yale's allocation model was seen as the benchmark for efficient long-term capital allocation.
"Studies show that asset allocation is responsible for more than 100 percent of the positive returns generated by investors… It’s because the other two factors, security selection and market timing, are a net negative." (David Swensen)

As soon as he became CIO of Yale endowment in 1985, Swensen promoted radical changes in its asset allocation: a) drastically reduced the allocation to fixed income and listed stocks; b) reallocated capital to Alternative Investments, mainly in private equity (buy-out, growth and venture capital); and c) created a sub-portfolio focused on absolute return, composed by hedge funds. The reallocation to private equity and hedge funds took place primarily through external managers, so that most of the portfolio was no longer managed by the Yale team to be outsourced to external managers.
At that time, the allocation to Alternative Investments was marginal and less than 10% of the total endowment portfolio. Yale was the forerunner in holding a substantial allocation to Alternatives that quickly exceeded 60% of the total portfolio. This decision proved to be the right one, adding considerable returns in subsequent years, which created (rightly so) the fame and reputation of Yale endowment.
Table 1: Allocation of the Yale endowment in different time periods
% Allocated (approximate) | Pre-Swensen | 1984 | D.Swensen Era | 2020 | M.Mendelsohn Era | 2025 |
Domestic Equities (EUA) | 65% | 3% | 3% |
International Equities | 15% | 11% | 12% |
Fixed Income/Cash | 15% | 5% | 5% |
Absolute Return | Hedge Funds | 0% | 22% | 20% |
Private Equity | 0% | 49% | 50% |
Real Assets (real estate, commodities) | 5% | 10% | 10% |
Illiquid Assets | 5% | 81% | 80% |
Source: Yale Investment Office
“First-mover advantage”
Yale clearly benefited from being the frontrunner in that it had access to a number of private equity managers whose access is now much more restricted[ii] (e.g., Greylock Partners, Sutter Hill Ventures, Benchmark, a16z). A Yale study[iii] concluded that 60% of alpha came from the correct selection of managers. In addition, Yale benefited from the flexibility and agility to reallocate capital given its much smaller size at the time ($1.3 billion, which is equivalent to just under $4 billion in current values, less than 10% of the current $44 billion).
As the endowment increased in size, returns declined, especially after the pandemic and subsequent rise in US interest rates. This phenomenon of diminishing returns is visible in the performance of other endowments. Rare are the cases of endowments that have been able to sustain double-digit annualized returns in windows of 10 years or more[iv]. Not coincidentally, returns have declined at the same time that those earned by private equity funds have declined.
Table 2: Total Assets and Returns until June/2024 - 12 Largest Endowments
| Total Assets | Performance (until 2024) | |
| USD bn | Last 5 years | Last 10 years |
Stanford Management Co. | 42,8 | 9,9% | 8,6% |
Yale University | 41,4 | 11,1% | 9,5% |
UTIMCO Permanent Fund | 36,5 | 9,4% | 7,7% |
Princeton University | 34,1 | 10,8% | 9,2% |
Massachusetts Institute of Technology | 24,6 | 12,2% | 10,5% |
UTIMCO Long-term Fund | 23,5 | 9,3% | 7,7% |
University of California | 22,6 | 9,4% | 8,1% |
University of Pennsylvania | 22,3 | 9,6% | 8,7% |
Columbia University | 14,8 | 8,5% | 7,4% |
University of Virginia | 14,2 | 10,4% | 8,7% |
Washington University in St. Louis | 13,2 | 11,5% | 8,7% |
Duke University | 11,9 | 10,2% | 8,6% |
Median of the 12 largest endowments |
| 10,1% | 8,7% |
46 endowments = total assets of USD 399bn |
| 9,4% | 7,9% |
Source: NABUCO (National Association of College and University Business Officers)
The average allocation of the largest endowments to Private Equity (which include buy-out, growth equity and venture capital investments) typically exceeds 50% of the portfolio.
Chart 2: Average allocation to Alternative Investments (% of total, over 5-year intervals)

Source: NACUBO (National Association of College and University Business Officers)
By definition, the Private Equity industry is an industry that is based on individual manager skills (the General Partner or GP) to generate alpha. The greater the competition, the fewer the market inefficiencies and the more scarce sources of alpha become.
Although the industry is much more competitive today than it was 20 years ago, whether by the metrics of assets under management (AUM) or the number of managers, curiously the degree of concentration of the industry has only increased since then. This phenomenon is also present in other investment strategies, including more liquid ones (within hedge funds universe, a similar case can be made for multi-PMs better known as pod shops, such as Millennium, Citadel and Point 72).
There are several studies[v] that indicate that the decay of alpha over time is a direct function of the AUM employed in that strategy. The bigger the AUM of an investment strategy, the lower the alpha available to be captured by active managers.
Other problems arising from the concentration in private equity are:
i) the so-called denominator effect, a phenomenon in which the proportion of alternatives in the portfolio tends to increase at times of correction of liquid assets, given that mark-to-market takes time to take effect; and
ii) the complexity of portfolio cash management, since the capital calls of the alternatives are not always fully financed by the capital returns of other alternative investments (the so-called DPI – Distributions to Paid-in Capital), which can generate a cash gap, especially at times when the percentage of distributions remains low as has occurred in recent years.
Yale's own endowment was compelled to reduce its private equity allocation in 2025[vi] by partially selling about $3 billion, which was equivalent to 15% of its asset class allocation.
The preliminary conclusion seems to be that the "Yale Model" is not dead, but has aged and lost effectiveness. Mind you that Swensen devised this allocation model more than 40 years ago, when the private equity (and hedge fund) industry was much smaller in size and competition was lower, which meant that good managers were more likely to deliver exceptional results.
Any allocation model that was built more than 40 years ago asks for updates. Allocation models must be adapted to financial innovations (new asset classes) and changes in macroeconomic regimes.
Allocating to Private Equity still makes sense?
There is no shortage of questions about the added value of Private Equity within a portfolio, whether for an institutional or individual investor.
One of the most acid critics of the "Yale Model" is Professor Ludovic Phalippou of Oxford, who has published several papers[vii] proving that the effective returns that Yale and others endowments obtained in their allocations of private equity, especially in buy-out, were slightly above the returns of the S&P 500 and other listed stock indexes. Even the returns reported in venture capital and growth equity have declined over the past 10 to 20 years, adding modest returns over publicly traded stock benchmarks.
It is worth remembering that the fees charged by private equity funds are sizable, especially when there is a performance fee – in some cases, it is estimated that the total fees paid by investors reach 5-6% p.a., which clearly impacts the net returns earned.
In addition to criticism about diminishing returns and high costs, there is also the issue of transparency about the companies invested in by the funds.
In any case, from the point of view of a capital allocator, not having any type of allocation in private equity or alternative investments seems like a mistake, even more so in a segment where the dispersion of returns between the best and worst managers is gigantic.
What is the best benchmark for a capital allocator?
Returning to the main focus of this article, if endowments are no longer the benchmark for a long-term capital allocator, which should be our benchmark then?
The answer may lie in the models adopted by other institutional investors, such as sovereign wealth funds and pension funds. A name that immediately comes to mind, as it is in practice the antithesis of the "Yale Model", is the Government Pension Fund Global (Norges), Norway's sovereign wealth fund.
The Norwegian parliament approved the creation of Norges in 1990 to insulate the economy from oil price fluctuations on the simple premise of creating a piggy bank for when oil runs out. The initial investments only took place in 1996 and today, it is the largest sovereign wealth fund in the world, with more than USD 2 trillion in assets.
There are 2 unique features of Norges that stand out:
1. Emphasis on beta rather than alpha. Beta and alpha are like the ying-yang within a portfolio, the combination of both creates a healthy balance to the portfolio. But the proportions of both must be adjusted over time, taking into account the macroeconomic cycle, the cycle of the specific active manager, and the higher costs of alpha-focused investments. The cost difference between alpha and beta-focused investments often becomes prohibitive and helps explain Norges' outperformance vis-à-vis some of its peers who tend to allocate primarily to active managers whose costs are much higher;
2. Zero allocation to Private Equity. After debates and detailed analysis on the merits of allocating to Private Equity[viii], Norges came to the conclusion that the additional risk premium (return) and lack of transparency arising from the illiquidity of the Private Equityit did not compensate for the risks of the investment.
Norges differs from its peers because of these two characteristics above, which make its capital allocation distinct and unique. But there is another peculiarity and, in our view, a strong comparative advantage, which lies in its own CEO, Nicolai Tangen.
Tangen has a distinctive DNA: in addition to his long experience both on the sell-side and buy-side - he was the founder and portfolio manager of one of the most successful equity funds in Europe, AKO Capital, where we were invested for several years. Before joining the financial market, he was part of the Norwegian army's special forces, from which he drew his discipline and work ethic.
"Compounding is massively underrated. Most people don't think properly in decades." (Nicolai Tangen)

During his time at AKO Capital, Tangen was known for his obsession with improving the investment process and incorporating psychology, neurolinguistics, and interrogation techniques (he even hired former Scotland Yard staffers) to analyze stocks from different angles. Tangen has always been a scholar of team management and how to improve decision-making[ix].
At the end of the day, the intellectual curiosity that has always guided Tangen translates, in our view, into the constant improvements in capital allocation and decision-making at Norges. Humility and intellectual flexibility are inherent characteristics of any successful investor.
Other benchmarks
Although sovereign wealth funds (Norges) and endowments (Yale) fall within the broad category of institutional investors, there are relevant differences in governance, organizational culture, and modus operandi between these institutions. This also applies to pension funds.
To complement the comparison between capital allocation models, we took into account the Canadian model (or "Maple Model") initially created by the Ontario Teachers Pension Plan in the 90s and replicated by the largest pension funds in Canada.

The "Maple Model" lies halfway between "Yale Model" and "Norges Model". Like Yale, it allocates a substantial part of the portfolio to Alternative Investments, but it does so directly, through its internal management teams, which allows it to incur lower costs and have better interference and governance of investments.
Table 3: Comparison (illustrative) between institutional investor allocation models
| Yale Model | Maple Model | Norges Model |
Main pillar | Focus on illiquidity premium | Focus on illiquid assets and real assets | Focus on liquid listed assets |
Objective | Maximize returns through alpha | Maximize returns through direct investments | Capture market growth through beta |
Management | External | Internal | Internal |
Cost | Alto (gestão terceirizada)High (outsourced management) | Moderate (compensation of internal management teams) | Low (focus on passive management) |
Source: Longview Capital
Table 4: Total assets, allocation and performance: Yale/OTPP/Norges
|
| Yale Model base date Jun/2025 | Maple Model (OTPP) date base Jun/2025 | Norges Model date base Dez/2025 |
Capital Allocation |
| (estimated values) |
|
|
| Fixed Income | 5,0% | 28,9% | 26,5% |
| Stocks | 15,0% | 9,4% | 71,3% |
| Absolute Return | 20-25% | 7,8% |
|
| Commodities |
| 15,6% |
|
| Private Equity | 35-40% | 19,5% |
|
| Real Estate / Infra | 10-15% | 18,8% | 2,1% |
Annualized Return | Last year | 11,1% | 7,1% | 15,1% |
| Last 10 years | 9,4% | 6,9% | 8,5% |
Assets under management |
| USD 44 bi | USD 198 bi | USD 2.2 tri |
(1) Yale's capital allocation ceased to be disclosed following the death of David Swensen in 2021. Approximate values as a function of the financial statements of Jun/2024 and Jun/2025. In the case of OTPP, allocations were calculated based on the amounts deducted from portfolio leverage
(2) Returns are in local currency: USD to Yale, CAD to OTPP and in the case of Norges, returns refer to a basket of 34 currencies
(3) Assets under management are approximate values, taking into account the exchange rates of CAD and NOK
Source: reports do Yale Investment Office, OTPP e Norges Bank Investment Management
How to adopt the best practices of these models for a Family Office?
Within a Family Office, there are two important constraints when trying to replicate institutional investor allocation models:
i. Absence of cash inflows: families that have already monetized (sold) their businesses have no expectation of new cash flow inflows. In the case of endowments and pension funds, there are annual inflows on account of donations or contributions from pensioners. In the case of sovereign wealth funds, cash inflows are usually the result of the accumulation of reserves, either due to surpluses in external accounts or the accumulation of natural resources such as oil. Therefore, the allocation of capital to families has to contemplate the absence of cash inflows from investors.
ii. Investment horizon: although some families intend to perpetuate their purchasing power for several generations, in practice, the investment horizon tends to be shorter than in the case of institutional investors, even more so with the absence of cash inflows described above. Generational changes can also negatively affect capital allocation.
Because of these distinctions above, long-term capital allocation to households tends to have more modest weights in Alternative Investments, often prioritizing options with greater liquidity (such as hedge funds).
Similarly to what happens with institutional investors, the issue of costs (what percentage of the portfolio will be outsourced to managers) and governance (transparency to the family about the portfolio, fostering synergies between family members and non-family members involved in portfolio management, and financial education of family members) are fundamental to the perpetuation of capital.
The lessons learned from benchmarks (institutional investor allocation models) are very useful in allocating capital to families, whether in what to replicate or in what to avoid.
References:
[i] https://president.princeton.edu/blogs/president%E2%80%99s-annual-%E2%80%9Cstate-university%E2%80%9D-letter-2026-growth-focus
[ii] https://www.innovosource.com/yale-endowments-venture-funds-hit-home-run/#:~:text=Yale%2C%20which%20made%20its%20first,in%20the%201990s; https://www.yalemodel.com/
[iii] https://www.morningstar.com/columns/rekenthaler-report/david-swensen-peter-lynch-institutional-investing
[iv] Vale comentar que algumas variações do “Yale Model” tiveram sucesso mesmo com o declínio dos retornos de Private Equity, como é o caso de Brown University. No caso de Brown, é notório que o time de investimentos pivotou praticamente toda sua alocação de Private Equity para investimentos em Venture Capital no setor de Tecnologia, numa decisão de “all-in”, o que permitiu capturar retornos muito superiores de seus pares. Por outro lado, vale notar que o endowment de Brown é significativamente menor (USD 8b) que seus pares, o que ajuda a explicar sua performance superior.
[v] Abhishek Bhardwaj & Abhinav Gupta & Sabrina T. Howell & Kyle Zimmerschied, 2025. "Does Fund Size Affect Private Equity Performance? Evidence from Donation Inflows to Private Universities," NBER Working Papers 33596, NBER; Evans RB, Rohleder M, Tentesch H, Wilkens M. Diseconomies of Scale in Quantitative and Fundamental Investment Styles. Journal of Financial and Quantitative Analysis. 2023;58(6):2417-2445. doi:10.1017/S0022109022000618; Marco Da Rin, Ludovic Phalippou,The importance of size in private equity: Evidence from a survey of limited partners, Journal of Financial Intermediation, Vol.31, 2017; Lopez-de-Silanes F, Phalippou L, Gottschalg O. Giants at the Gate: Investment Returns and Diseconomies of Scale in Private Equity, Journal of Financial and Quantitative Analysis. 2015;50(3):377-41
[vii] Phalippou, Ludovic, Is Yale a Model?, Sept 2011, https://ssrn.com/abstract=1950257 ; Ludovic Phalippou, Christian Rauch, Marc Umber, Private equity portfolio company fees, Journal of Financial Economics, Vol.129, Issue 3, 2018; Ludovic Phalippou, Yale’s Endowment Returns: Case Study in GIPS Interpretation Difficulties, The Journal of Alternative Investments, Spring 2013; FRANZONI, F., NOWAK, E. and PHALIPPOU, L. (2012), Private Equity Performance and Liquidity Risk. The Journal of Finance, 67: 2341-2373; Phalippou, L. (2023). Performance of Private Equity Funds Post Covid. In: Cumming, D., Hammer, B. (eds) The Palgrave Encyclopedia of Private Equity. Palgrave Macmillan, Cham.; Capital Commitment, L. Phalippou, E. Gourier and M. Westerfield, 2024, 79(5), Journal of Finance; Phalippou, L. “The Trillion Dollar Bonus of Private Capital Fund Managers.” Management Science, Institute for Operations Research and Management Sciences, 2025.
[viii] Houve discussão sobre o tema de unlisted equities (private equity) em 2008, 2010 e mais recentemente em 2023-2024 (https://www.nbim.no/en/news-and-insights/submissions-to-ministry/2023/investment-strategy-for-the-government-pension-fund-global--unlisted-equities/ ). O Norges pode, no entanto, investir até 5% em ativos não listados de Real Estate e Energia Renovável
[ix] Tangen é o apresentador de um ótimo podcast (“In Good Company” - https://www.nbim.no/en/news-and-insights/podcast/ ). Algumas entrevistas recentes (onde Tangen foi o entrevistado) revelam a
spectos muito interessantes de sua forma de pensar sobre alocação de capital e gestão de times e pessoas: https://youtu.be/zyvuM3J9QqQ?si=RFWEdk1VcmGyYEVA ; https://youtu.be/t3Lvyx7eLTs?si=vVDgvNptYDERxy5J ; https://www.mckinsey.com/capabilities/risk-and-resilience/our-insights/an-interview-on-building-organizational-resilience-a-board-level-priority-in-todays-challenging-times#/ )